The Art Of Collaboration
January 22, 2024
DateTime with ASP.NET
February 8, 2024
I know of many individuals whom find JavaScript to be this big scary boss fight, when it comes to developing and dugging the errors. Which is why I am writing this blog. JavaScript is a confusing programming language to start with but if you get the hang of it, you will not regret it.
The techniques I will be going over are the following
Debugger Statement
In all my years of developing with JavaScript I have found this debugger; statement to be an amazing debugger tool as it halts the execution of code and launches the browser's built in debugger.This powerful method enables you to inspect the call stack, set breakpoints, and navigate through your code step by step.
Browser Developer Tools
Understanding how to use your developer tools within your browser is extremely bennifical for you, as you will most likely be spending alot of your time staring errors. For the sake of this blog post I will not be covering absolutely everything in the developer tools. However, I do incourage you to read up on it abit more.
To get to your developer tools you need to either click "F12" on your keyboard or right click in the browser window and select "inspect". A window or pane will open with the developer tools.The main features I find useful are the "console", "network" tabs.
The console tab is used for viewing any feedback from the application whether its a console.log or an error, chances are that it will be displayed here. In the network tab this is where you would monitor your network activity thats taking place on your application.
Console logging
Finally! the most helpful technique console logging. Console logging is basically what we all see as part of the "Debugging 101". Simply put yes it is, but are you logging out the data in the most optimal way to get to the fix quicker?
- console.log - We all know
console.log('hello world');. This is the easiest and most well known method used for logging out data objects, strings, numeric values and all sorts of other data types. Another console logging method that functions close to this would be theconsole.info('hello world');method but is used mainly to pass along general messages to the console, and depending on the browser it may render in console differently from theconsole.log('hello world');method but there is nearly no difference between the two method. - console.warn - This method is not widely utilised within standard web applications. However, it does function similarly to the
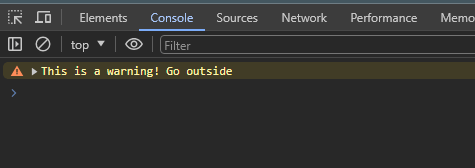
console.log('hello world');method but instead it raises the log as a warning. For example you invoke it by usingconsole.warn('This is a warning! Go outside');, and it will look something like this in your console when it is executed: - console.error - This method is to force the console to notice something as an error. For example if there is a code block that the user was not meant to reach but there is a possiblity you can use
console.error('You are not meant to be here');to help you identify this error as it will display the custom message to the console in red, making it more noticable to you as the developer while debugging the code. - console.table - Saved the best for last. This is a very helpful logging method, because if you are like me and have to work with alot of arrays/objects sometimes it can be time consuming to locate the issue in an array of objects. To make this easier for us we can use
console.table([{name:"Audi", model:"A4"},{name:"Volvo", model:"XC90"},{name:"Ford", model:"Fusion"}]);. This will print the values to the console in a nice table format allowing you to see all the values immediately as you open the console.


Conclusion
We covered a very brief set of methods to assist you with debugging your code in JavaScript. We covered the debugger statement, browser developer tools and console logging.
I hope this has been helpful. I truly enjoy working with JavaScript and I hope you do to!


